A Step by Step Guide to Pear Assessment Assessment Data and Reports

.svg)
.svg)
.svg)
You give assessments in Pear Assessment (formerly Edulastic) to find out how well students understand the material, which students need more help, whether the help you are providing is working, and how each student is progressing toward mastering the standards. The good news is you can answer all of these questions with the free Teacher version, though premium versions will give you more detail when it comes to analyzing the assessment data. Here's our step by step guide to Pear Assessment data and reports.
How are my students doing on this test?
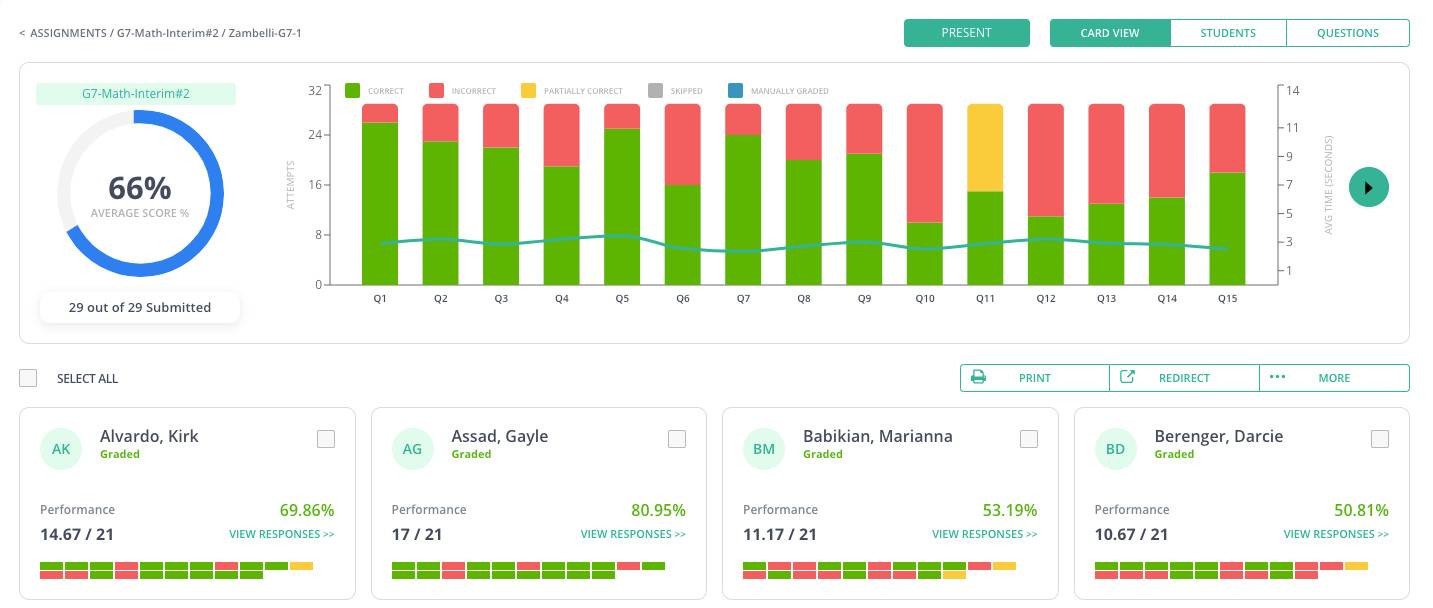
The Live Class Board shows student performance in real time. As students work on the assessment, the bars turn green for correct, red for incorrect, and yellow for partially correct. Blue means manual grading required, such as for an essay. With the assessment data populating all in one place, you'll have a nice at-a-glance look at what's going on.
You’ll see the questions many students struggled with on the top graph. Drill down to look at the question. Was it confusing, or perhaps a skill that needs review?
Pro tip: When a student is currently working on a question, the bar turns dark gray. Watch for students who might be stuck on a question for longer than you think they should.
Which concepts are many of my students struggling with?
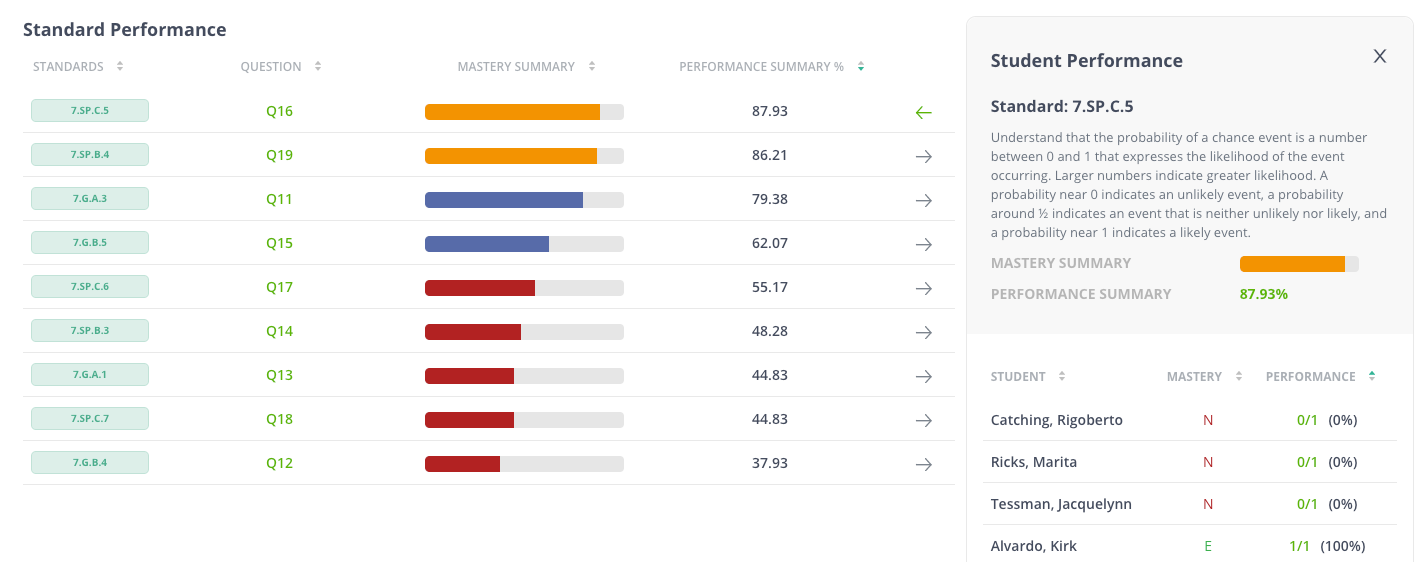
Head over to the Standards tab to see how well the class understands each standard. Are they as proficient as you would expect given the amount of instruction and practice time spent in class so far?
Click on the arrow to get a list of students who missed questions tied to that standard. These students might need additional instruction or practice, which you can find in the free Test Library.
Why is this student struggling with these questions or standards?
Click on the students with lower scores than you expected. Look at the questions they missed or skipped, and how long they spent on them (green line on the graph) Is there a pattern? For example, students who skip constructed response may need additional scaffolding or prompts to get started in answering (even in math questions).
Students who skip or miss questions without spending any time, like Q4 above, likely need more help.
Is the student missing (or skipping) questions aligned to just one of the standards? Are they struggling with higher DOK questions or questions at the end? This could be a challenge with test stamina, meaning you might get a better indicator of concept understanding with shorter assessments.
How are my students progressing towards standards mastery?
The Standards Mastery Report tracks student progress toward mastering standards for the whole school year.
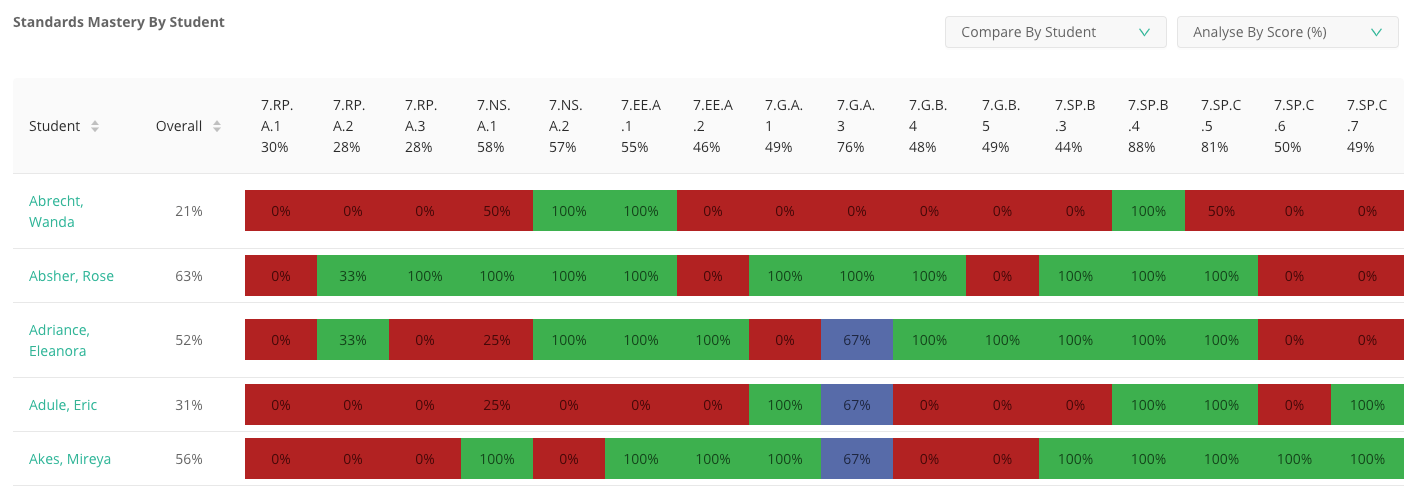
With a simple spreadsheet layout, you can see which students have yet to master each standard so you know where to focus with them as the year progresses.
Premium Reports: Dive deeper into assessment data
The Teacher Premium and Enterprise versions of Pear Assessment allow you to take a deeper dive into your assessment data, track progress over time, and print reports for parents/guardians.
How are my remediation or subgroups understanding the material?
On the Sub-group Performance tab, you can compare classes, student demographic groups (if you have shared that information, or student groups you have created). In this example, you can see that 4th period did significantly better than the other two classes.
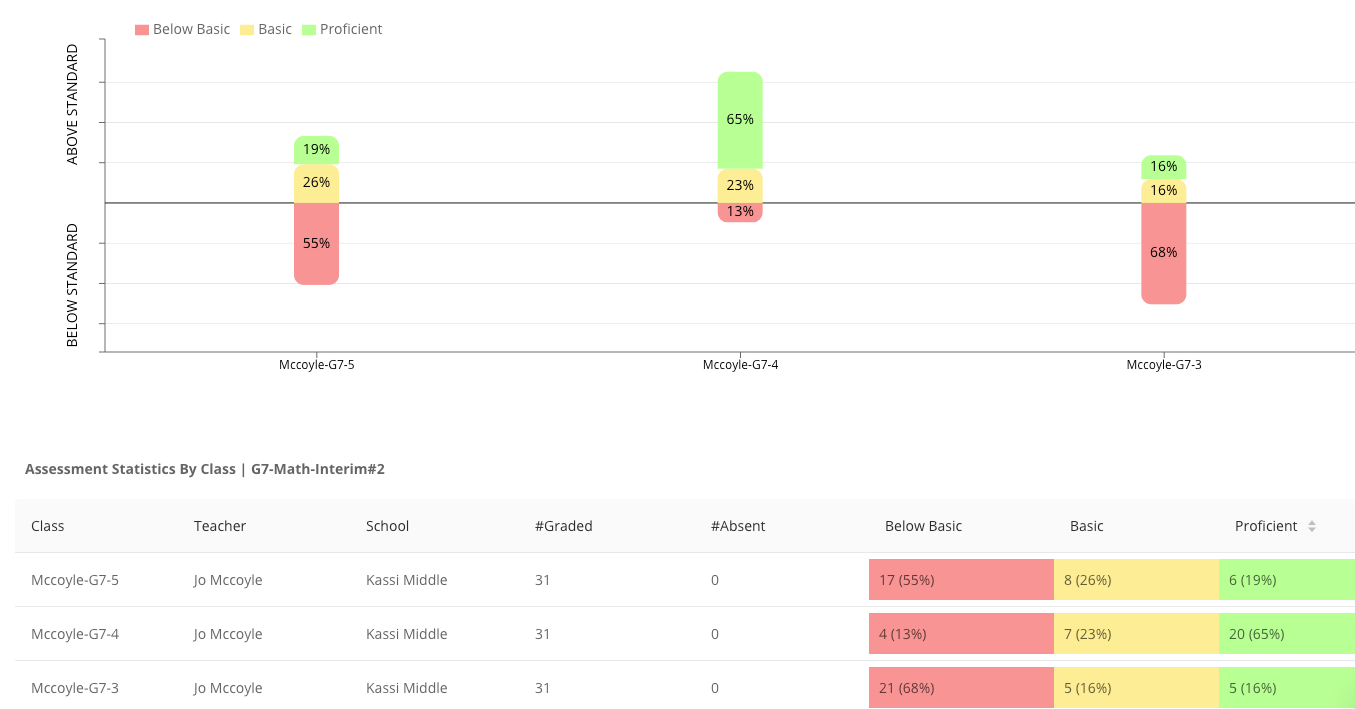
If you group students for remediation after a unit test, you can see how they did on those standards after the next assessment versus the rest of the class.
The Standards tab shows how students or student groups performed on each standard included in the assessment.

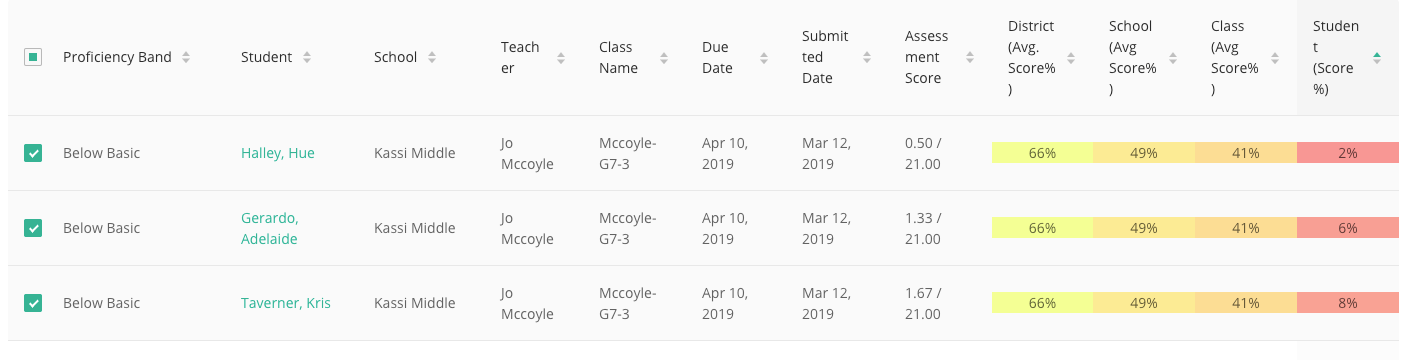
How do my students compare to the rest of the school or district?
The Performance by Students tab shows average school and/or district scores compared with your classes for common assessments. You can also easily group students who performed in the lowest proficiency bands for remediation, or those in the highest ones for additional challenge work.
What were the common mistakes students made?
The Response Frequency tab shows the most common errors on missed questions, allowing you to correct the specific misconceptions of your students.
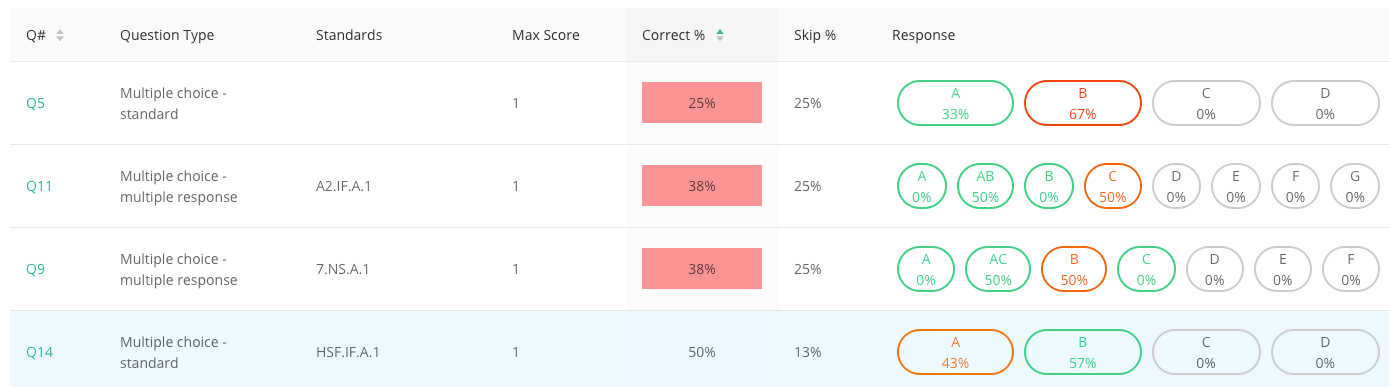
Move the left slider to set the threshold for highlighting questions where 20% of students answered incorrectly, or 40% or whatever you choose. Move the right slider to highlight answers that tripped up at least 20% of the students, or whatever you choose. You can see the actual question by clicking on the question number.
Are my students making progress?
As you give assessments throughout the year, you’ll want to know which students are making progress and which need more help. Select the assessments to designate which assessment data you want to compare to see growth.
If your assessments include multiple standards, you’ll want to see whether students are making progress each one, rather than the test as a whole. Click on the Standards Progress report and choose the standard at the top.
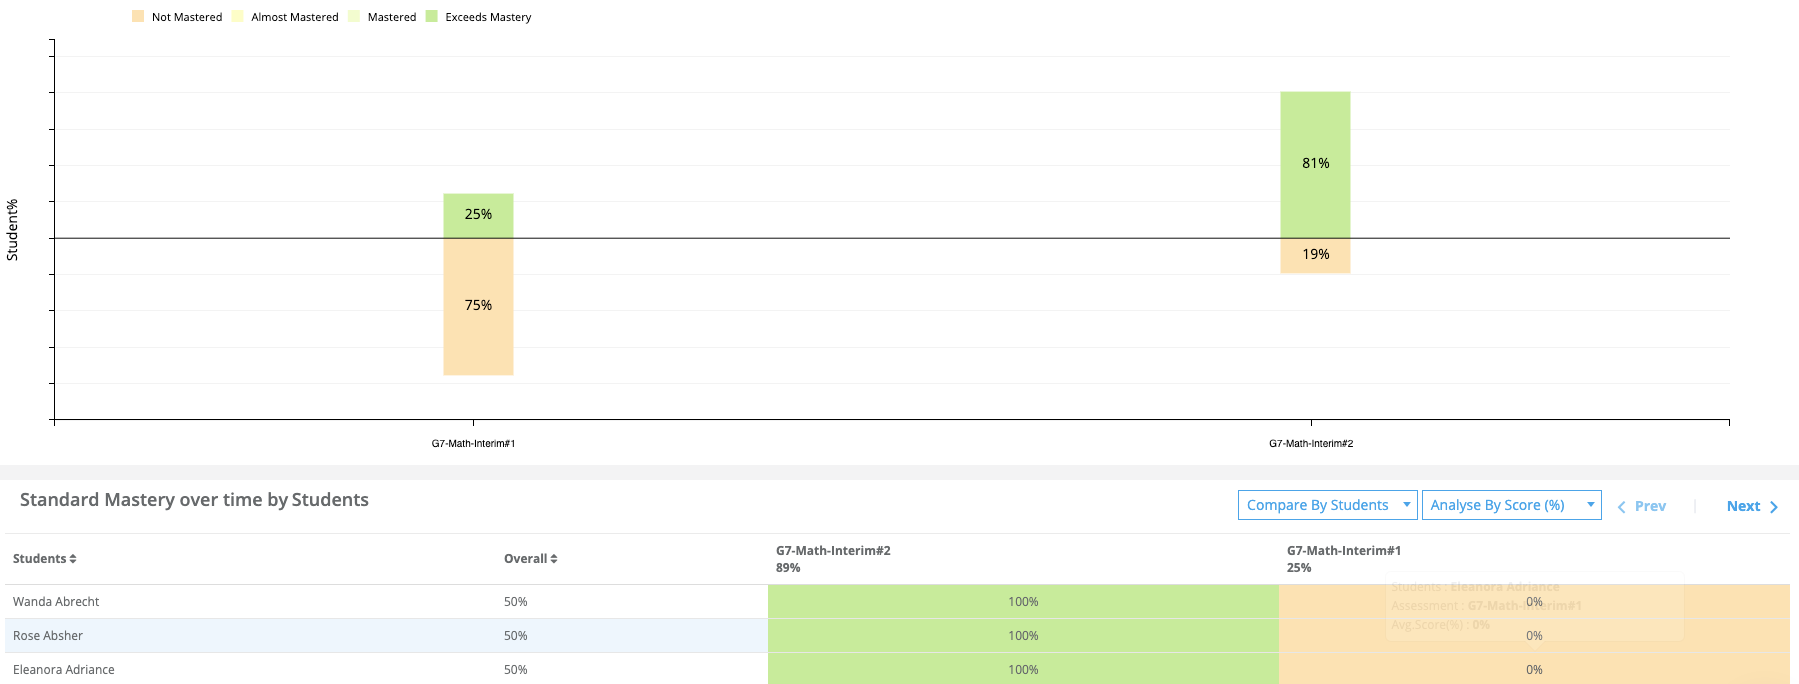
You can see how each student scored in each assessment on that one standard to easily spot increasing and declining trends.
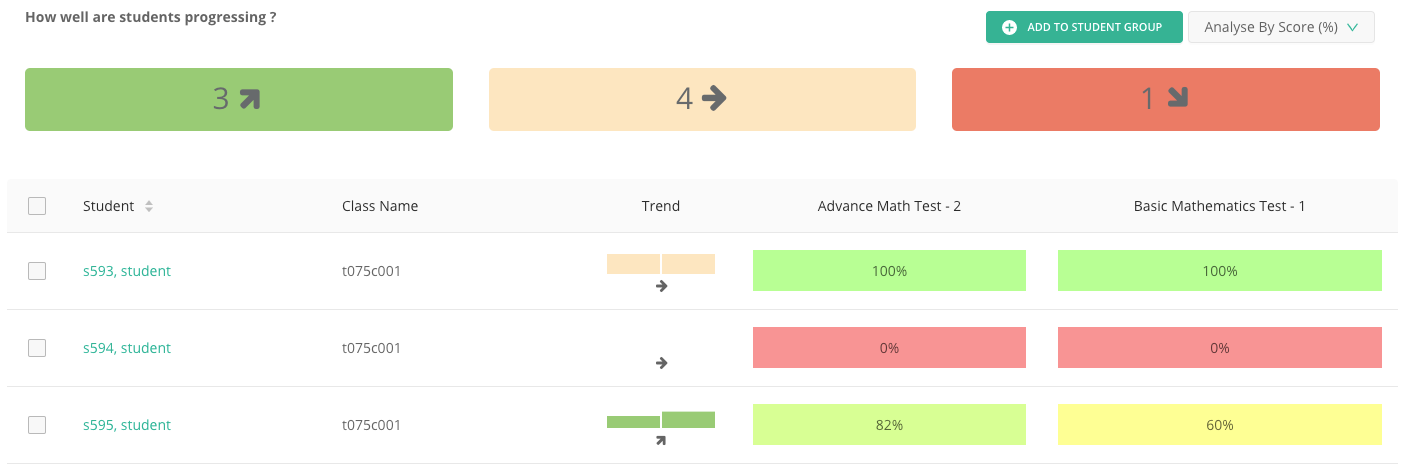
Which students or student groups are trending up and which are trending down?
On the Student Progress tab, see how each student progressed from one assessment to another. Check out scores, or break down by performance bands. Click on the green or red tiles to get a list of the students who showed growth (or a down trend) from one assessment to another.
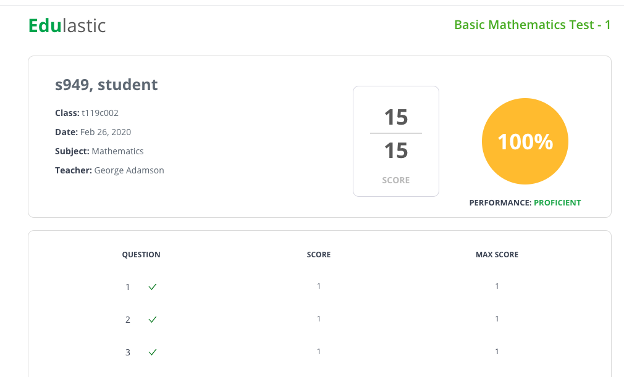
How can I communicate student progress to parents or guardians?
For an individual assessment, you can download and print a customizable Student Report Card. Choose the data you want to share (question level or standard level responses and performance, and overall performance band).
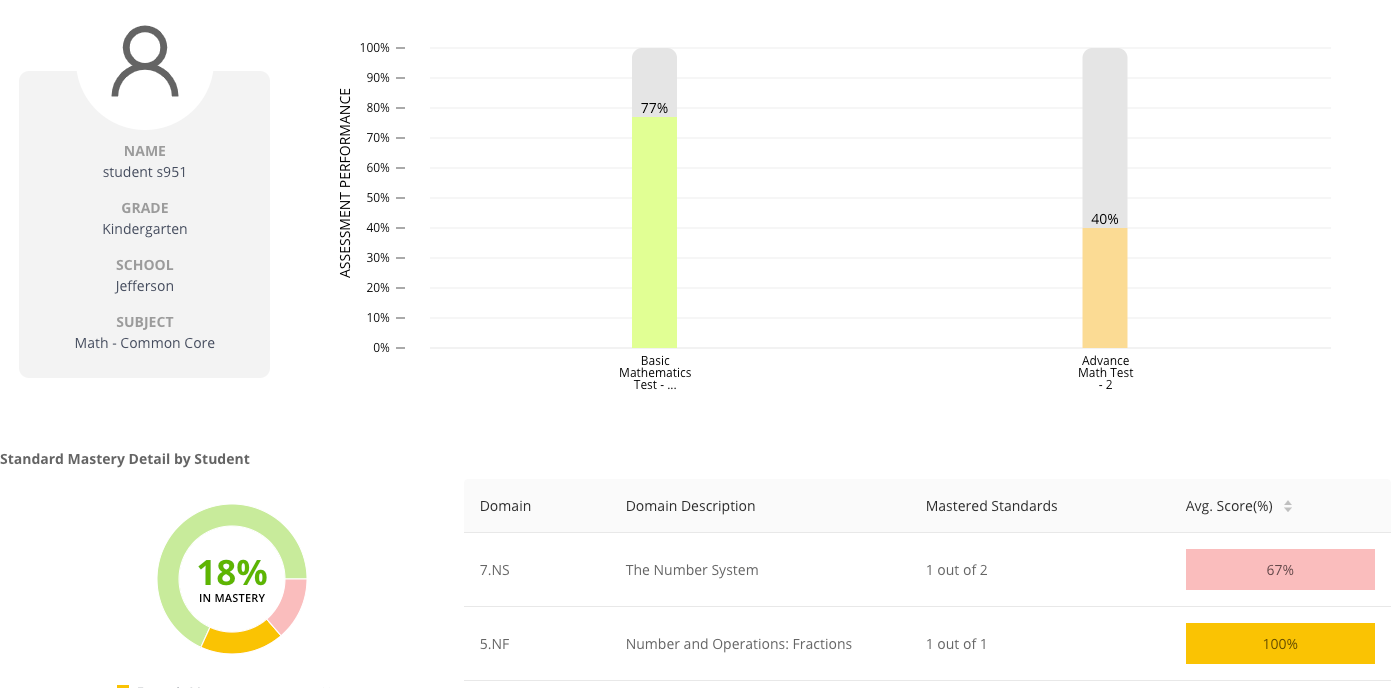
The Student Profile Reports give you comprehensive data on each student, which you can also print and share with parents. The Summary tab shows assessment data results and standards mastery status, while the other two tabs provide more details on each of these.
As you get to know the tools available to you in Pear Assessment, you’ll be on your way to informing instructional decisions through sound assessment data. At the Enterprise level you can monitor progress across grade levels, and make sure student learning is on track. The insights track mastery, which helps you identify progress of individual students and where a struggling student may need help.
As you deliver formative assessments throughout the year, you'll be able to easily track how students are doing over time. As you give summative assessments for grades and reporting, you'll be able to quickly deliver and view the assessment data. You'll even save time grading since Pear Assessment provides automatic grading services to quickly collect student data as students complete the tasks you deliver them.
Click the button below to learn even more about how to interpret assessment data on Pear Assessment and for a closer look at Pear Assessment's robust suite of reports.

.png)