What’s New in Pear Assessment: SAT & AP Calculator Practice, AI Deep Dive, and More
Pear Assessment

Our most recent Pear Assessment updates bring SAT, AP, and state-exam calculator practice to your students, speed up paper grading, give you precise control over accommodations, and surface the insights in your reports faster. Read on to see what’s new.
Desmos Calculator Update to v1.12.0
With the upgraded Desmos Calculator suite (version 1.12.0) in Pear Assessment, students can practice with the same calculator tools they’ll use on state exams. The update applies across all assessment delivery workflows and improves the accuracy of statistical calculations. It also brings the full functionality of the standard Desmos calculator into your assessments, so you can ensure testing fidelity and complete alignment with the calculator used in state exams.
State Testing Environment Alignment: Accurately mirror the calculation outputs and layout used in official state summative testing environments.
Desmos API v1.12.0 Engine: Upgraded the core embedded Desmos engine for Basic, Scientific, and Graphing calculators to version 1.12.0.
Complete Statistical Summary: Get the full picture from the stats( ) function, which now displays Count, Mean, Median, and Standard Deviation alongside quartiles, rather than only the five-number summary.
How to Get Started:
- Enable the required calculator (Standard / State) from student tools under Test Settings
- Students can click the Calculator icon in the toolbar to use the corresponding Calculator.

New College Board Calculator Configuration
Pear Assessment now includes a dedicated College Board calculator option across the Graphing, Scientific, and Basic Desmos calculators, purpose-built to replicate the digital testing interface and restrictions of SAT and AP exams. Students preparing for these exams can practice in the exact calculator environment they will encounter on test day, so they build familiarity with the tools and limitations ahead of time. With an official College Board configuration available in your assessments, you can support authentic test readiness and help build student confidence across your high school programs.
Dedicated College Board Option: Adds "College Board" as a third configuration alongside Standard and State for Basic, Scientific, and Graphing calculators.
High-Stakes Testing Fidelity: Practice with the exact interface parameters and restrictions the College Board mandates for digital SAT and AP testing environments.
How to Get Started
- Navigate to Tests and open or create an assessment.
- Go to Test Settings and navigate to the Calculator section.
- Under Show Calculator (Desmos), select College Board for the desired calculator type (Basic, Scientific, or Graphing).

Express Grader Access for Paper Assignments
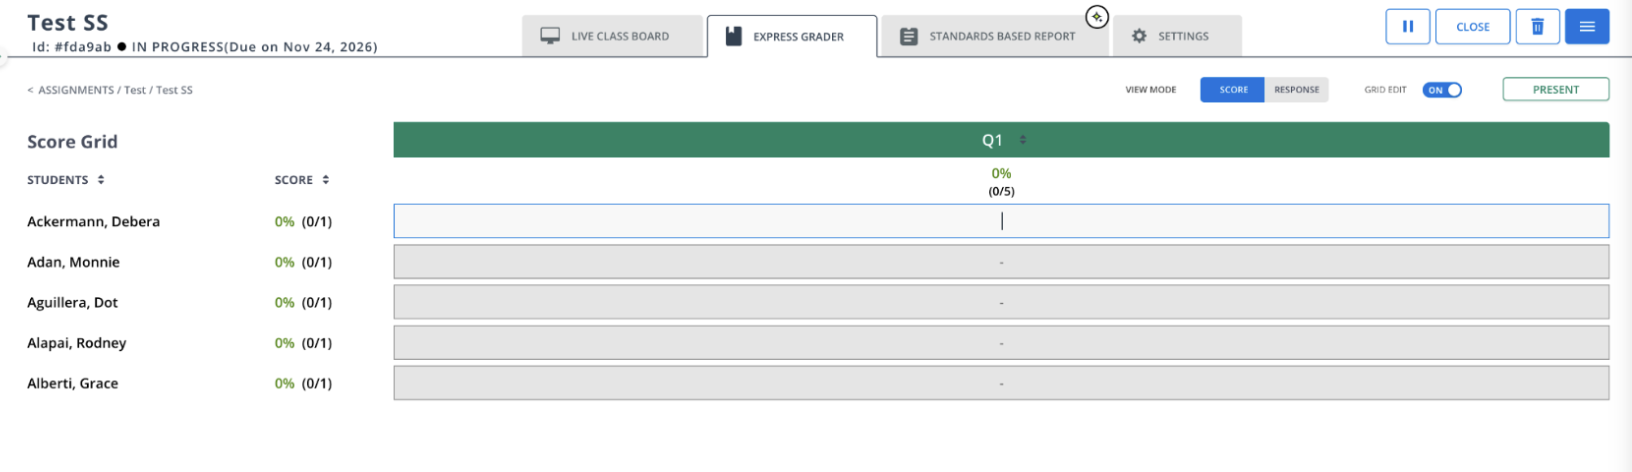
Educators can grade paper-based assessments in Pear Assessment immediately, without navigating repetitive confirmation dialogs. In hybrid and paper-based classrooms, entering scores no longer requires typing confirmation text into pop-up windows, so you can move straight from the stack of papers to the gradebook. Removing these extra steps saves valuable time and speeds up your grading turnaround.
Frictionless Grading Entry: Enter Express Grader to input scores for "Answer on Paper" assignments with fewer clicks.
Fewer Confirmation Pop-ups: Skip the repetitive dialogs that used to require typing “Submit” or confirming status changes when closing assignments or updating student statuses for paper tests.
Dedicated Absence Marking: Added the ability to mark a student as "Absent" directly, while remaining students are automatically marked as submitted when closing the assignment.
How to Get Started
- Navigate to Assignments from the left navigation bar.
- Select an active assignment designated as Answer on Paper.
- Mark all students as submitted or close the assignment without confirmation prompts, then open Express Grader to enter scores.
Subject-Level Text-to-Speech (TTS) Accommodations
Pear Assessment now enables districts to provision and manage text-to-speech (TTS) accommodations at the subject level, rather than only student-wide. This helps you comply with state policies where TTS is authorized for specific subjects, such as Math or Science, but restricted for others, such as Reading. Students receive the exact support they are entitled to without over-provisioning accommodations, so your assessments stay accurate and aligned with policy.
Granular Control: Choose which subjects text-to-speech applies to for each student with the new “Subjects TTS applies to” multi-select field in student accommodation settings.
Automated Provisioning: Sync subject-scoped TTS automatically through OneRoster, Clever, and ClassLink, so accommodations stay current without manual entry.
Class-Level Overrides: Make immediate adjustments from the Live Class Board with the new “Allow Text To Speech For Items” dropdown.
Learn more about subject-level TTS.
How to Get Started
- Administrators: Navigate to Manage District > Users > Student > Update User > Configure Accommodations.
- Teachers: Navigate to Manage Class > Class Details > Select Student > Edit Student > Configure Accommodations.

AI-Powered "Deep Dive" in Reports (Peary Integration) & User-Driven Insights
Pear Assessment has moved from automatic AI generation to a user-triggered model, so AI processing only happens when you actually need it. You can also use the new conversational “Deep Dive” for follow-up analysis. Instead of spending time manually analyzing complex data tables, you get the most important insights surfaced automatically. A structured, AI-guided workflow helps you quickly identify student needs and learning gaps, so you can focus on the instruction that makes the biggest impact. The “Deep Dive” feature is currently available for Single Assessment Reports, with support for other report categories coming soon.
User-Driven AI Summaries: Stay in control of when AI runs, since summaries now generate only when you click the “Generate Summary” button.
Summaries in Peary: Get a high-level summary of your report data as soon as Peary opens.
Guided Exploration: Explore your data with pre-listed question “chips” based on the initial summary and report data, with no free-text entry needed.
Dynamic Questioning: Choose from the top 5 most relevant questions, which update dynamically based on what you’ve already asked so you can drill deeper into the data.
Learn more about using Peary in reports.
How to Get Started
- Open any report (like Single Assessment or Trends) and click the "Generate Summary" button in the AI panel.
- Once loaded, click "Deep Dive with AI" (available in Single Assessment reports only) to start a conversation.

Controlled Filter Sharing
Shared Reports in Pear Assessment now give report owners more control over how others interact with the filters they set. You’ve always been able to pre-set filters when sharing a report, but viewers could only see the filtered data and couldn’t change the filters. Now, you can choose whether to allow viewers to edit filters on shared reports. Turn editing on, and a shared report becomes a starting point for analysis, where colleagues can apply additional filters and customize their own views. Keep editing off, as it works today, when you need to restrict the view, such as demographic reports shared with PLC groups, so viewers can only access the data they are authorized to see.
Lockable Filters: Keep filters locked for viewers by leaving the “Allow recipients to edit filters” checkbox unchecked in the Share modal.
Preserved Configurations: Return to the exact view the report owner intended at any time by selecting “Reset to Shared Filters.”
Identity Protection: Rest assured that even when filters are editable, recipients can only view data within the data access scope selected when the report was shared.
Learn more about sharing in Pear Assessment.
How to Get Started
- Click the "Share" button on any report.
- In the modal, configure your filters and toggle the "Allow recipients to edit filters" checkbox before sending.

Data Studio: Performance Distribution Defaults
Now, the Performance Trends report in Data Studio opens to student proficiency levels by default, rather than simple average scores. Average scores can hide gaps, so seeing the distribution up front helps you immediately identify whether a large group of students is falling behind, regardless of the mean score. With this view as your starting point, you can spot learning needs sooner and focus your attention where it matters most.
New Default View: See Performance Distribution first, as the “Analyze By” toggle now defaults to it instead of Average Score.
Immediate Insight: See how many students fall into performance bands the moment the report opens.
Full Flexibility: Switch back to Average Score or other metrics with a single click whenever you need them.
How to Get Started
- Navigate to Data Studio.
- Then click on Performance Trends. The report will automatically load the Distribution view by default.

Minor Improvements
Demographic Data Expansion: Added support for syncing additional student metadata from Classlink, including Disability and 504 status, for better reporting insights.
Enhanced Canvas Sync: Canvas Course and Section IDs are now displayed in sync dropdowns and the bulk sync table to help teachers accurately identify their courses.

